
If you’ve been following the headlines, you’d think Toronto’s real estate market is in freefall. Prices are down, listings are up, and everybody’s talking about the “correction”. But Toronto’s March 2026 real estate statistics tell a more nuanced story, one where the market is quietly shifting in ways that most people aren’t paying attention to.
Yes, prices are lower. Yes, homes are taking longer to sell. But for the first time in six months, sales actually went up year over year. New listings dropped significantly. And the gap between what sellers are asking and what buyers are paying is narrowing. If you’re only reading the headlines, you’re missing the real story.
Let’s dig in.
The Big Picture: March 2026 by the Numbers
Five Things to Know About the March 2026 Stats
1. Sales turned positive for the first time in six months, and supply is tightening
March saw 5,039 homes sell across the GTA, a 1.7% increase over March 2025. That’s the first year-over-year sales increase since last September. On its own, that’s noteworthy. But pair it with what’s happening on the supply side, and the story gets more interesting.
New listings dropped 16.7% to 14,442, and active listings fell 8.0% to 21,596. Fewer sellers are entering the market, and the inventory that built up over the past year is starting to get absorbed. The market isn’t roaring back, but it’s quietly tightening. Buyers who are waiting for the “perfect” moment to jump in should be watching these supply numbers closely.
2. The economy shrank, but buyers showed up anyway
Canada’s GDP came in at -0.6% for Q4 2025. Unemployment sits at 8.1%. Inflation is at 1.8%. None of that screams “go buy a house.” And yet, more people bought homes in March than in the same month last year.
What’s driving it? A combination of things: rates have stabilized (the Bank of Canada held the overnight rate at 2.25%), affordability has improved with lower prices, and there’s a growing sense among buyers that waiting hasn’t been paying off. Pent-up demand is real, and for many households, life doesn’t wait for perfect economic conditions.
3. The LDOM/PDOM gap is shrinking, and that’s a good sign
Here’s a stat most people skip over: the gap between Listing Days on Market (LDOM) and Property Days on Market (PDOM) narrowed to 16 days in March, down from about 22 days in January. LDOM measures how long the current listing has been active (31 days in March), and PDOM measures total time on market including previous listings (47 days).
Why does the gap matter? A large gap means properties are being delisted and relisted, usually because they were overpriced the first time. A shrinking gap means sellers are pricing more realistically from the start. That’s healthy. It means fewer games, faster transactions, and a market that’s functioning more efficiently.
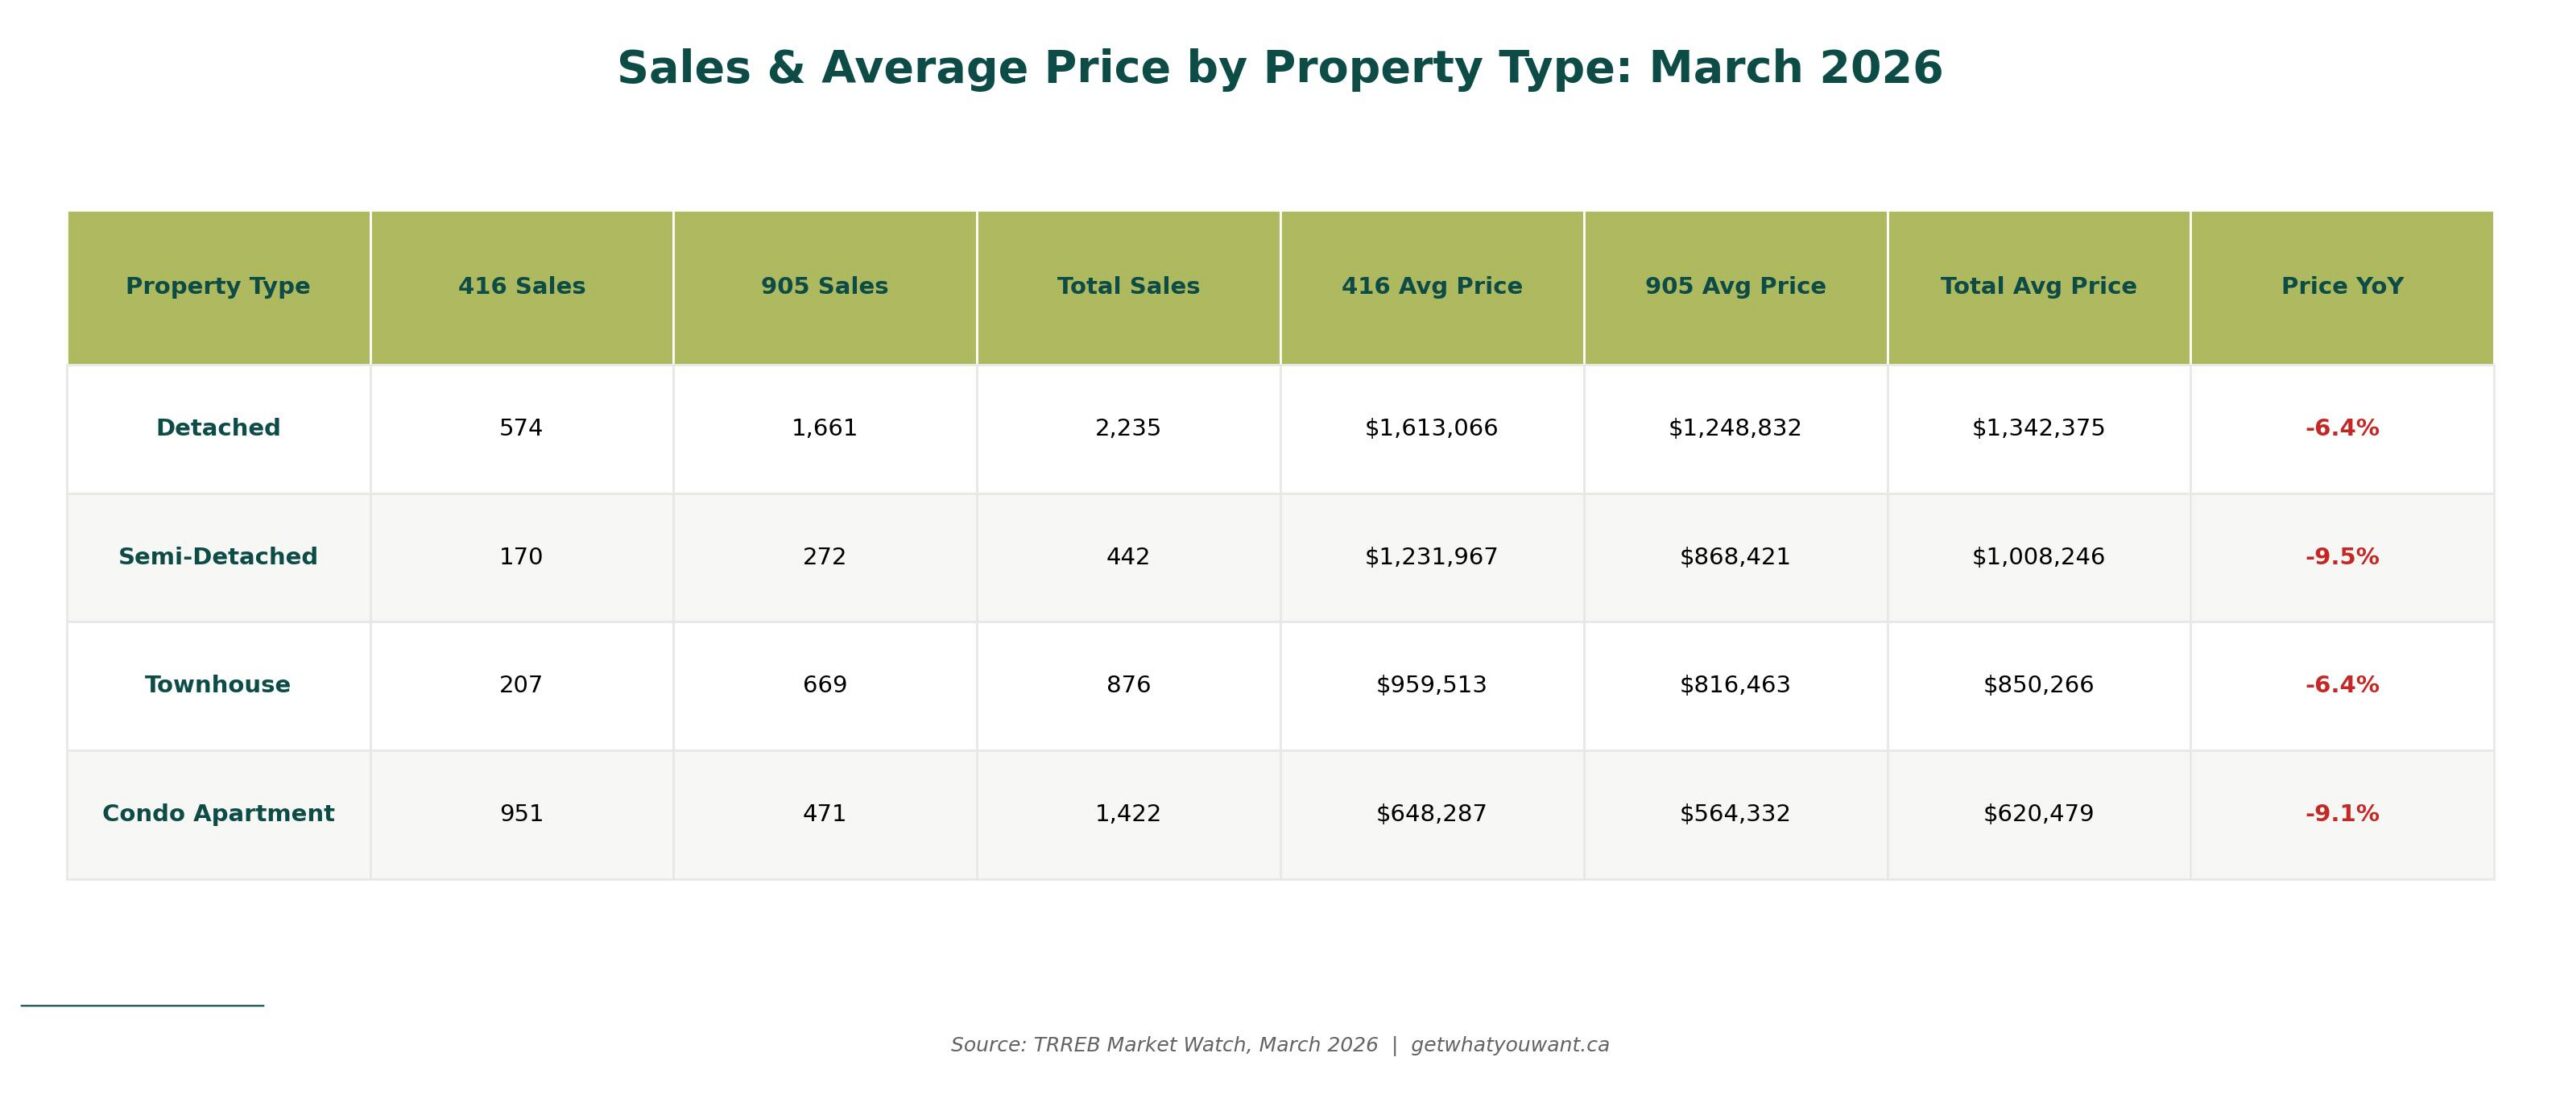
4. Condo prices are down 9.1%, but buyers are coming back
The condo segment continues to see the steepest price corrections. The average condo apartment sold for $620,479 across the GTA in March, down 9.1% year-over-year. In the 416, condo prices dropped 9.6% to $648,287. That’s a significant correction by any measure.
Worth noting: condo sales in the 416 were up 3.0% year over year. Volume is returning even as prices fall. That’s what the early stages of a market floor look like. Buyers are deciding that current prices represent value, even if they’re not sure prices have bottomed out completely. For end-users (not investors), the math is starting to work again.
5. Where you buy matters more than ever
The neighbourhood data tells a story of widening divergence. In the east end, E01 (Leslieville/Riverdale) saw its composite HPI benchmark drop just 5.28% year over year to $1,066,100, and E02 (The Beaches/Upper Beaches) dropped 7.43% to $1,280,500. These are among the mildest corrections in the city.
Compare that to W03 (Stockyards/Corso Italia), where the composite benchmark fell 11.87% to $863,100. The spread between the best-performing and worst-performing neighbourhoods is nearly 7 percentage points.
What’s behind the divergence? Neighbourhoods with strong owner-occupier demand and limited condo inventory are holding up better. Areas with heavy investor ownership and lots of new condo supply are correcting harder.
Neighbourhood Prices: What the HPI Data Tells Us
We use the MLS Home Price Index (HPI) rather than average prices for neighbourhood analysis because HPI controls for the mix of homes selling in any given month. Average prices can swing wildly based on whether a few expensive or inexpensive homes happen to sell. HPI gives you a much more reliable picture of what’s actually happening to values.
All data below is from the TRREB MLS HPI for the City of Toronto, March 2026.
West End
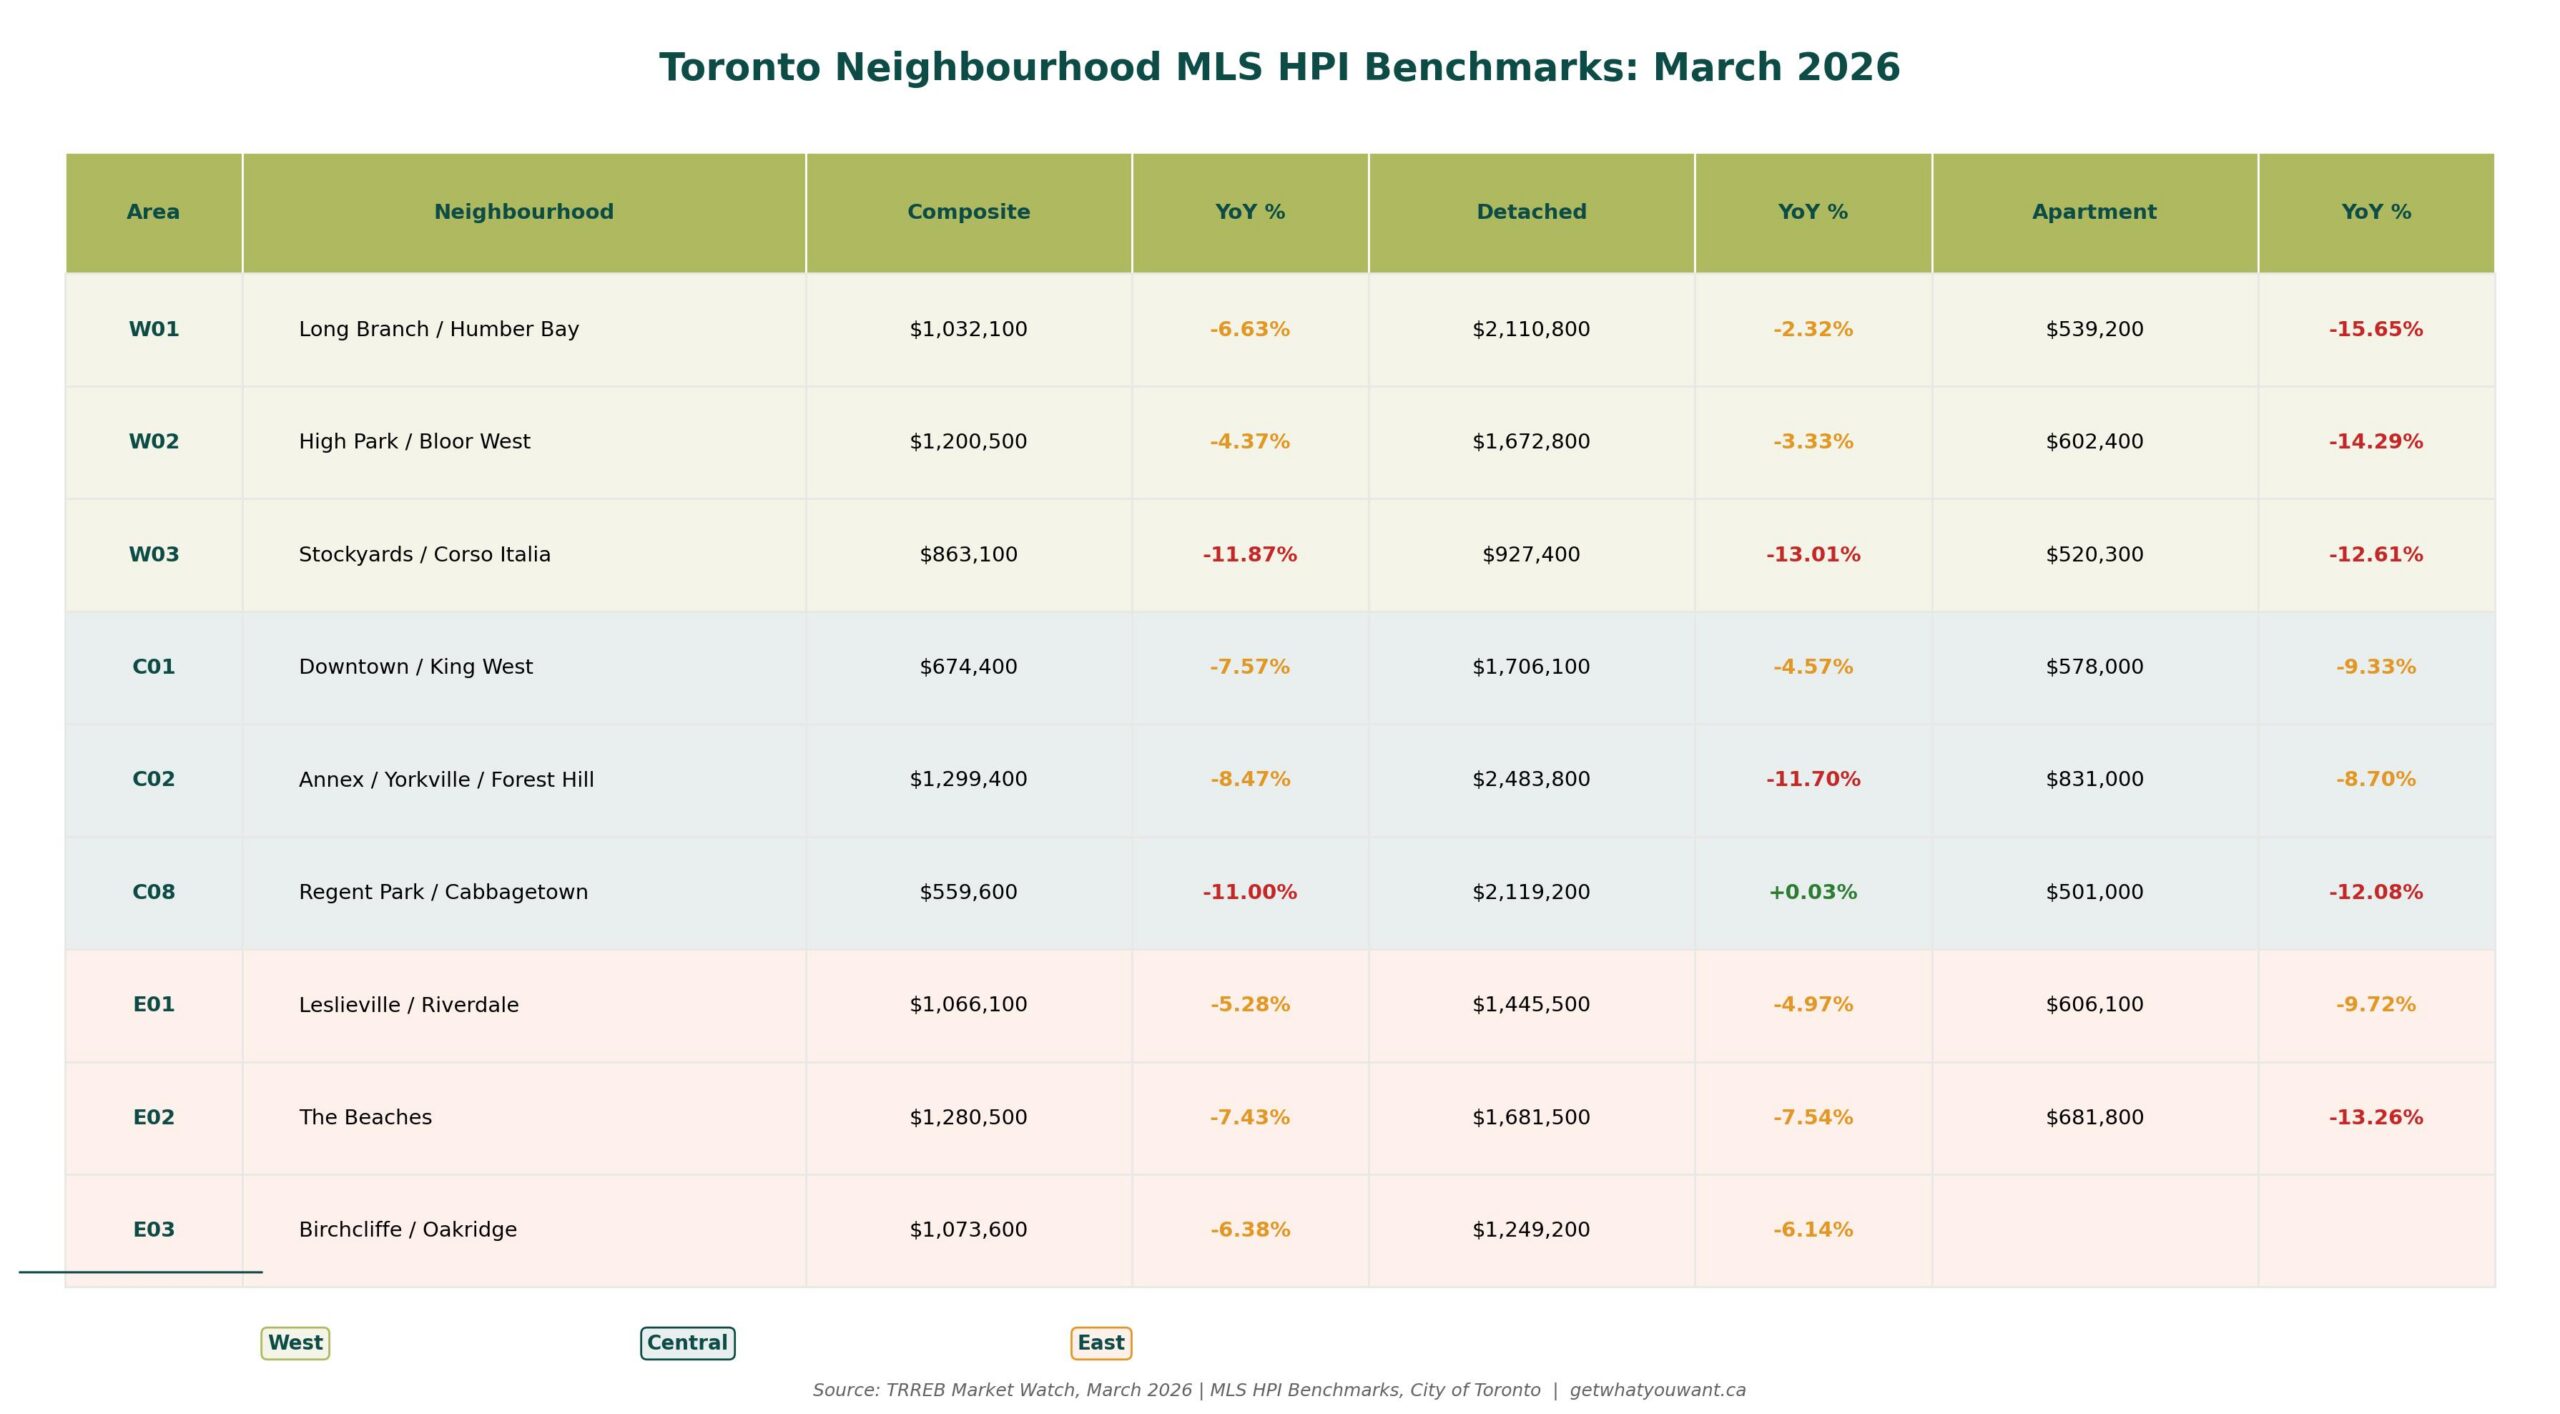
- W01 (Long Branch to Humber Bay) saw its composite benchmark land at $1,032,100, down 6.63% year over year. Detached homes held up relatively well at $2,110,800, dropping just 2.32%. The condo segment took a harder hit, with apartment benchmarks down 15.65% to $539,200.
- W02 (High Park/Bloor West Village) is actually one of the more resilient areas in the west end, with a composite benchmark of $1,200,500, down just 4.37%. Detached homes held steady at $1,672,800 (-3.33%). But the apartment segment tells a different story: benchmarks fell 14.29% to $602,400, one of the steeper condo corrections in the city.
- W03 (Stockyards/Corso Italia/Rockcliffe-Smythe) posted one of the city’s sharpest corrections, with the composite benchmark falling 11.87% to $863,100. Detached homes were down 13.01% to $927,400, and apartments fell 12.61% to $520,300.
The Takeaway: The west end is a tale of contrasts. W01’s detached segment and W02’s composite are holding up well, but W03 is correcting hard across the board with double-digit declines in every category. And even in the areas where freehold prices are stable, condo prices are down 12-15%. Buyers looking for value should watch W03 closely over the next few months.
Central
- C01 (Downtown/King West/Liberty Village) has a composite benchmark of $674,400, down 7.57%. Detached homes in the core sit at $1,706,100, down just 4.57%, but the apartment benchmark dropped 9.33% to $578,000. Downtown condos are bearing the brunt of investor exits and elevated supply.
- C02 (The Annex/Yorkville/Casa Loma/Forest Hill) saw its composite benchmark fall 8.47% to $1,299,400. Detached homes took a notable hit, down 11.70% to $2,483,800. The apartment benchmark sits at $831,000, down 8.70%.
- C08 (Regent Park/Cabbagetown/St. James Town) posted the steepest composite drop in our tracked neighbourhoods at 11.00%, with benchmarks at $559,600. The detached segment is a rare bright spot, essentially flat year over year at $2,119,200 (+0.03%). Apartments fell 12.08% to $501,000.
The Takeaway: Central Toronto’s story is really two stories. The freehold segments in premium neighbourhoods are holding up better than the condo segments, where oversupply and investor selling are creating real pressure. If you’re a buyer looking at a downtown condo, you have significant negotiating power right now.
East End
- E01 (Leslieville/Riverdale/South Riverdale) continues to be one of the city’s most resilient areas, with a composite benchmark of $1,066,100, down just 5.28%. Detached homes sit at $1,445,500 (-4.97%), and apartments at $606,100 (-9.72%).
- E02 (The Beaches/Upper Beaches) has a composite benchmark of $1,280,500, down 7.43%. Detached homes are at $1,681,500 (-7.54%), and apartments at $681,800, down 13.26%.
- E03 (Birchcliffe-Cliffside/Oakridge/Scarborough Village) saw its composite benchmark at $1,073,600, down 6.38%, with detached homes at $1,249,200 (-6.14%).
The Takeaway: The east end continues to outperform the rest of the city on composite benchmarks, particularly E01 and E03. These neighbourhoods have strong owner-occupier bases and less exposure to the condo correction. That said, even here, apartment prices are down 10-13%, so no segment is completely immune.
What Else You Need to Know
There’s a lot happening outside the monthly stats that will shape Toronto real estate in the months ahead. Here’s what we’re watching:
The HST exemption on new homes is a game-changer
On March 30, Prime Minister Carney and Premier Ford announced an $8.8 billion joint investment that removes the full 13% HST on new homes valued up to $1 million, with savings maintained up to $1.5 million. That’s potential savings of up to $130,000. On top of that, development charges are being cut 50% for three years. If you’ve been considering new construction, the math just changed dramatically in your favour.
The Bank of Canada is holding steady… for now
The BoC held its overnight rate at 2.25% in March and signalled it’s in wait-and-see mode. Markets are actually starting to price in potential rate increases in the second half of 2026 if trade tensions ease. The “rates only go down from here” narrative that dominated last year? It’s over.
Pre-construction is still frozen
RBC Economics published a deep dive on Toronto’s pre-construction condo market and it’s bleak for developers: investor appetite has evaporated, construction delays are averaging 8-14 months, and project launches are being shelved. The silver lining for end-users is less competition and more negotiating power on the few projects that are moving forward.
Immigration cuts are reducing demand structurally
Permanent resident targets dropped from 464,000 in 2024 to 380,000 for 2026. Canada’s population is projected to decline 0.2% this year. TD Economics estimates this will reduce Canada’s housing gap by 534,000 units by 2030. This isn’t a blip, it’s a policy shift that will soften demand for years.
Ontario’s rent increase guideline dropped to 2.1%
The 2026 guideline is the lowest in four years, down from 2.5% in 2025. Nationally, rents have been declining for 16 consecutive months. If you’re a condo investor counting on rental income to cover your carrying costs, the math is getting tighter.
75% of GTA neighbourhoods saw homes sell below asking
A recent analysis found nearly three-quarters of GTA neighbourhoods had average sale prices below list prices in March, with the overall ratio at 98%. This is a buyer’s market by almost any definition.
Advice for Toronto Buyers
If you’ve been sitting on the sidelines, the March data gives you a few reasons to start paying closer attention. Sales are rising, supply is tightening, and the HST exemption on new homes is the most significant affordability policy we’ve seen in years.
You have negotiating power right now. Homes are selling at 98% of asking price on average, and in many neighbourhoods, well below that. With the average home listed for 47 days in March, sellers have been waiting, and they’re motivated.
If new construction is on your radar, the HST exemption and 30-year amortization for new builds make this a genuinely different calculation than it was six months ago. Run the numbers.
Don’t fixate on timing the absolute bottom. Markets don’t ring a bell. What we can tell you is that the conditions favouring buyers (high inventory, motivated sellers, lower prices, stable interest rates) are all present right now. They won’t last forever.
Advice for Toronto Sellers
Pricing is everything in this market. The shrinking LDOM/PDOM gap tells us that well-priced homes are selling, while overpriced homes are sitting. If your home has been on the market for more than 30 days, it’s time for a serious pricing conversation.
The good news: new listings dropped 16.7%. You have less competition from other sellers than you did a year ago. The bad news: buyers have options, and they’re negotiating hard.
If you’re selling a condo, especially in the downtown core or in areas with heavy investor ownership, you need to be realistic about where the market is. Prices are down 9-12% depending on the neighbourhood, and wishful pricing will cost you time and money.
For freehold sellers in the east end and parts of the west end, your segment is holding up better than most. Price it right and you’ll find buyers… this market rewards accuracy.
The BREL Bottom Line
March was an interesting month for the BREL team, with a significant uptick in sales and the number of buyers and sellers reaching out. We’re seeing more motivated buyers, more showings and faster sales and we’re excited to be launching more new listings in April than we have in years. We’re cautiously optimistic about a ‘normal’ spring market in Toronto this year.
March 2026 might not look like much on the surface. Prices are still down, homes are still taking longer to sell, and the economic backdrop is uncertain. But underneath those headlines, the market is shifting. Sales turned positive. Supply is tightening. Sellers are pricing smarter. And buyers are showing up.
Add in the HST exemption on new homes and stable interest rates and you’ve got a market that’s finding its footing.
Is this the bottom? We don’t know, and anyone who tells you they do is guessing. What we do know is that the conditions for buyers are as favourable as they’ve been in years, and the window won’t stay open indefinitely. For sellers, the message is simple: price it right, and the buyers are there.
Spring is here. The market is waking up. Pay attention.